As you plan how to build a dynamic pricing model in your ticketing and sales team, keep your audience at the center of your decision-making process.
There are many data points informing an effective dynamic pricing strategy, and they have one thing in common: they can also boost your audience loyalty strategy. Use your data wisely and you’ll gain valuable insight that brings you closer to your audience, their values, their preferences, and their needs.
Below are some of the key metrics and reports that keep the data you need at your fingertips as you build your strategy.
Establish a baseline
Every audience is different. The unique data that you collect in your Spektrix system and elsewhere will give you a great starting point from which to build a closer connection to your audiences.
Before you get started with a dynamic pricing strategy, take a look at existing data to establish a baseline from which you can derive your pricing rules.
Average spend
How much is your audience used to spending?
Based on the average price of all events in your dataset, an average spend report shows how the average price per event compares to your average pricing across events. The standard report in your Spektrix system then also breaks this down to show further information such as the value of tickets sold. Matching these metrics with event types gives you an idea of which types of shows are popular and how that compares among the range of events you’re presenting.
When designing a flexible pricing model, keep the historical average spend of your audience in mind. Your audience will reward you with loyalty when you are transparent about your pricing and don’t take it to extremes. Meeting expectations is one element of building loyalty – and when it comes to ticket prices, your audience will have expectations from previous visits.
Popular price bands
Different price bands in your venue are an essential part of any flexible pricing and adjusting them is a popular way to introduce dynamic pricing. Reports can help you identify which price bands are favored by your audience. Keep in mind that this could be influenced by price, view or individual preference. Any post-event analysis, including the standard report in Spektrix, will give you a breakdown of the most popular price bands and the average price within it by taking into consideration metrics like percentage of tickets sold and the average yield.
Try asking questions like, “Which areas are selling best?” or “If an area is particularly popular, should we consider raising prices?”. The answers could help you build loyalty by reserving sought-after areas to reward your most loyal audience members or changing your pricing strategy for the less popular bands. They can also help you design a dynamic pricing experiment to test how willing your audience is to accept change to the status quo.
"Try asking questions like, 'Which areas are selling best?' or 'If an area is particularly popular, should we consider raising prices?'"

Bence Marosi, CEO of DynamO – a dynamic pricing partner in the Spektrix partner network – advises ticketing and sales teams to “dissect purchasing patterns through scrutinizing real-time and historical sales curves, spanning various temporal segments and show attributes” to reveal peak purchasing times and customer segments.
When you build a dynamic pricing model, you might want to start small and experiment with an isolated test event, or a short series of events. These can help you test your assumptions. Over time, as your pricing becomes adaptable and responsive, you’ll see the changes in your pricing model affect your baseline – that’s a good sign.
The depths of audience behavior
The data you are collecting go beyond the spending patterns you see at specific shows, whether you’ve already built a dynamic pricing model or are planning to. Your audience members are your greatest advocates, and an audience-centric approach to your pricing and loyalty strategy will make it clear if something isn’t working for them.
Audience members and households
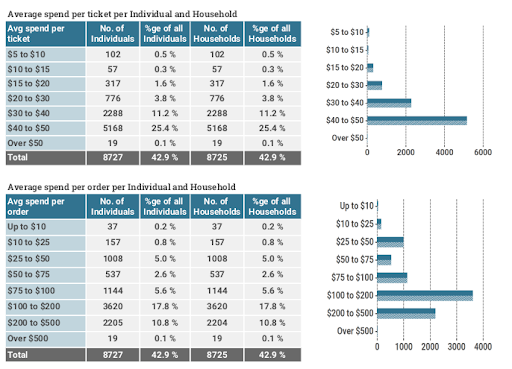
It can be useful to look at the bigger picture and analyze the behavior of your entire audience, rather than the behavior at specific events (as a price band or average spend report will). A metric that you want to look for is the average spend per individual/household – this will give you an idea of the range your audience members are willing to spend and how the typical order of one group measures up against another. You can even use segmentation to take a closer look at key segments of your audience like your top donors or repeat visitors.
This kind of report gives you an insight into the buying power of your audience. It might change over time when external factors like inflation or wider economic pressures affect your audience’s willingness to spend – this is one to look out for to meet your audience where they’re at and price your events with them in mind.
Seat popularity
Whereas a price band analysis gives you an idea of what range of seats are popular at which price, you can go much more granular than that. For example, you can look at which seats are the most sought after. Find the best seat in the house, based on data alone. In Spektrix, you can create a report that outputs each seat in your seating plan and details:
- how many times it has sold
- its average price
- the value that seat has cumulatively brought
(Note: Creating this report in Spektrix will output the information as raw data)
This is useful for delving into questions like “If this seat is the most popular, could it be more expensive?”. Not every audience member is motivated by the lowest price – some are there for the experience and some, indeed, want the best view you have to offer – especially when a show is popular. Use this knowledge sparingly, and keep your goals in mind when putting the data to use.
Whether you're 'maximizing revenue', 'maximizing ticket sales' or 'enhancing early bookings': Each event, ticket category, and sector can be priced according to distinct customer segment propensities without implementing individualized pricing, ensuring equitable costs for all patrons.Bence Marosi, CEO
DynamO
Listen to your audience
Dynamic pricing experts DynamO describe the combination of dynamic pricing and audience insights as “nurturing a dependable and mutually beneficial relationship between event organizers and their attendees.”
Identifying patterns and predicting future sales contributes to accurate ticket pricing, and enhances customer satisfaction and loyalty. By minimizing unsold tickets, it supports a consistent value proposition, ensuring equitable pricing and enabling access to varied events.Bence Marosi, CEO
DynamO
Not every data point that helps you build a dynamic pricing model will involve numbers. Experts from Digonex and JCA recommend taking more unusual factors into consideration when assessing your audience members’ perception of value and willingness to pay – both central elements of your strategy. These factors could include the performers or director of any given play, the genre, the weekday or even the weather on the day of attendance. Piece by piece, you’ll build a good image of your audience.
And how does your audience feel about your pricing? Sometimes, asking them is the straightest way to an answer. Direct feedback is much harder to quantify than numbers in your system, but that doesn’t make it any less valuable or worthwhile. Your audience members will appreciate the direct connection, and their opinions might surprise you.
How to build a dynamic pricing model that lasts
What comes first – building a dynamic pricing model or building your audience loyalty strategy? They might be less separate than you thought – the same audience insight data will support both. “Granularity in data not only reveals optimal timings for ticket sales but also opens avenues for strategic, data-driven customer engagement”, concludes Marosi.
Once the data have aligned your own and your audience’s values, motivations, and goals, they’ll shape your connection to your audience through flexibility. You can be strategic without becoming rigid. Whether you’re going all out or starting with a small dynamic pricing experiment, now is the time to revisit your audience data.