

8 min read
Data on the diversity of our team, management and board in 2023, and our work to build a more inclusive workplace over the last 15 months.
In July 2020 and December 2021 we published data on the demographics of our team, as part of our commitment to build, measure and continually improve the overall diversity of the team and the experience of every individual working at Spektrix. In 2021, we also outlined our approach to data collection in detail - from the principles by which we work, to our practice in designing questions and naming categories for team members across multiple global regions.
The major changes we made to our survey in 2021 made it impossible to draw useful comparisons with our results from 2020. This year, however, we’ve made only minor adjustments to the survey, and I’m pleased that this allows us to more directly assess how the diversity of our team is changing.
If you have questions about any of our plans or approach, we’d be delighted to speak with you - please reach out on consultation@spektrix.com.
How to read the data
The most recent survey was run in March 2023 and reflects the makeup of the team at this point in time. It doesn't reflect any changes that have happened since then.
In March 2023, 97% of team members responded to the survey. This marks a significant increase from 90% in December 2021 and 82% in July 2020.
All figures are shown as percentages; team members who did not participate are not included in the data for any year, so percentages are given as a proportion of participants, rather than a proportion of all team members.
At Board and Senior Leadership Team (SLT) level, we’re looking at small numbers of people, meaning that a single change within the team can have a significant impact on percentages. Throughout, we describe data changes from 2021 to 2023 in one of two ways:
-
As a percentage point (pp) change. In most cases, we’ve used this approach to highlight a change in group size - for example, if 10% of team members identified as female in 2021, and 15% did so in 2023, this would be a change of 5 percentage points.
-
As a percentage (%) change. In some cases, smaller group sizes mean that a minor percentage point change can represent a significant shift within a specific group. In the same example, a change in group size from 10-15% represents a 50% increase in the proportion of team members identifying as female.
The colors used in these visualizations have been chosen to be visible to as many viewers as possible, including people with color blindness or other visual impairments. Numerical data is also included to support anyone unable to view the visualizations. If you struggle to access the data in either format, please get in touch.
Spektrix team data: 2021 - 2023
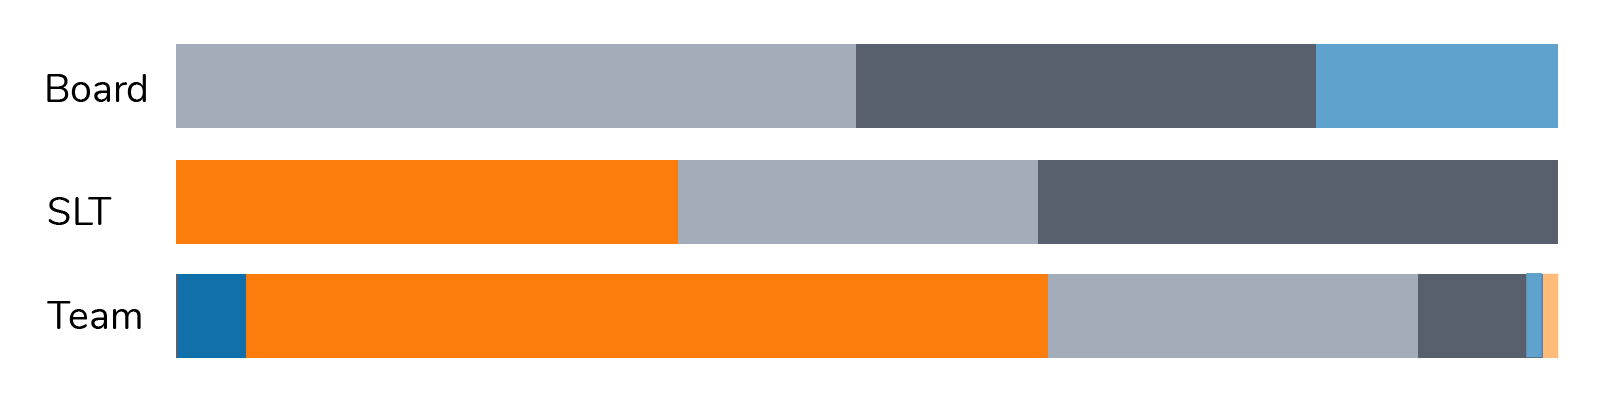
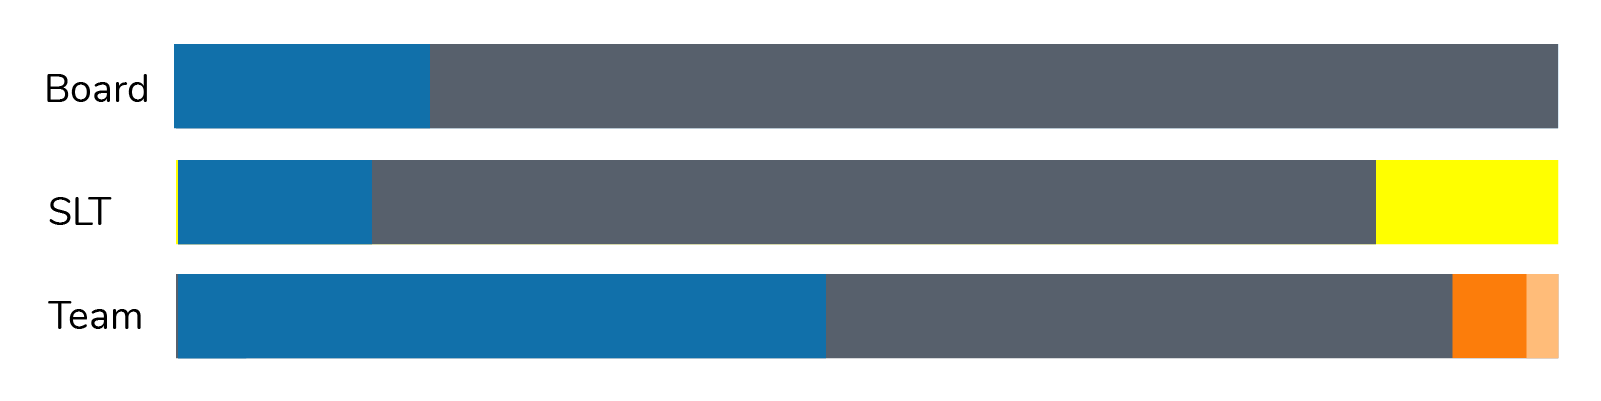
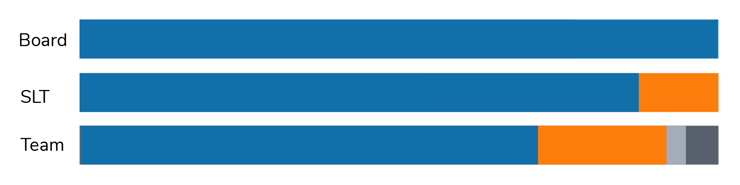
What was the occupation of your main household earner when you were aged about 14?
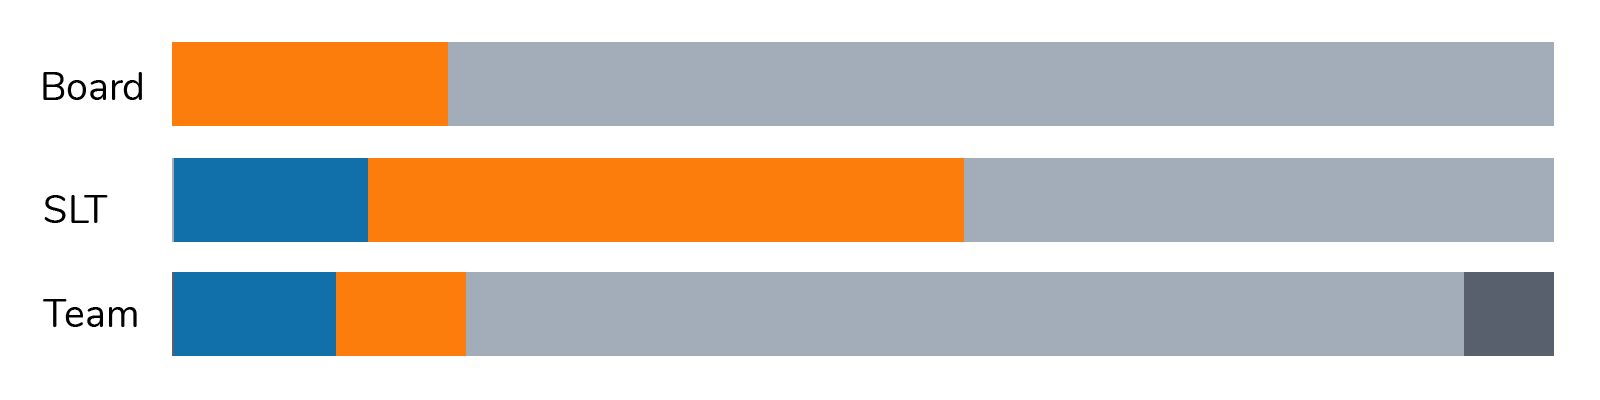
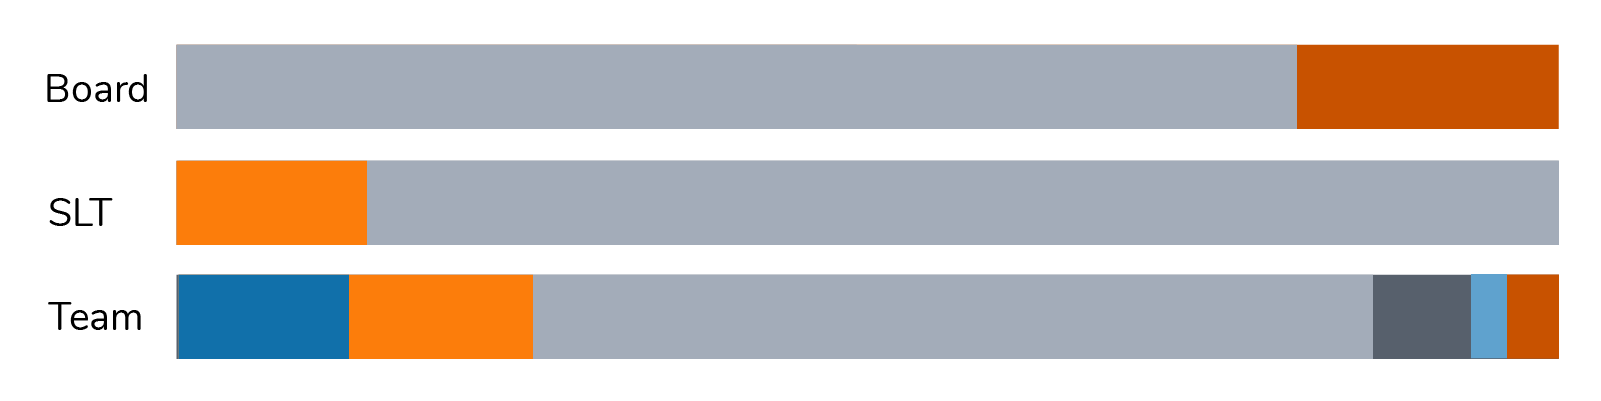
This question looks at the socio-economic background of team members (i.e. how privileged/affluent a background people have come from). There is no perfect way to measure socio-economic background, however we have taken the approach recommended by the UK's Social Mobility Commission. Respondents selected one of seven categories, which have been aligned to three economic background levels in this data in line with Social Mobility Commission guidance.
A free text field was not offered for this question.
Since 2021, the proportions of the whole team who come from lower and intermediate socio-economic backgrounds have both increased by 70-75%.
2021
2023
| Key | Aggregated response | Year | Team | SLT | Board |
|
|
Lower socio-economic backgrounds | 2021 | 11.8 | 14.3 | |
| 2023 | 20.2 | 12.5 | |||
| Intermediate backgrounds | 2021 | 9.1 | 42.9 | 20.0 | |
| 2023 | 15.5 | 37.5 | |||
| Professional backgrounds | 2021 | 72.7 | 42.9 | 80.0 | |
| 2023 | 60.1 | 50.0 | 66.7 | ||
| Exclude | 2021 | 6.4 | |||
| 2023 | 4.2 | 33.3 |
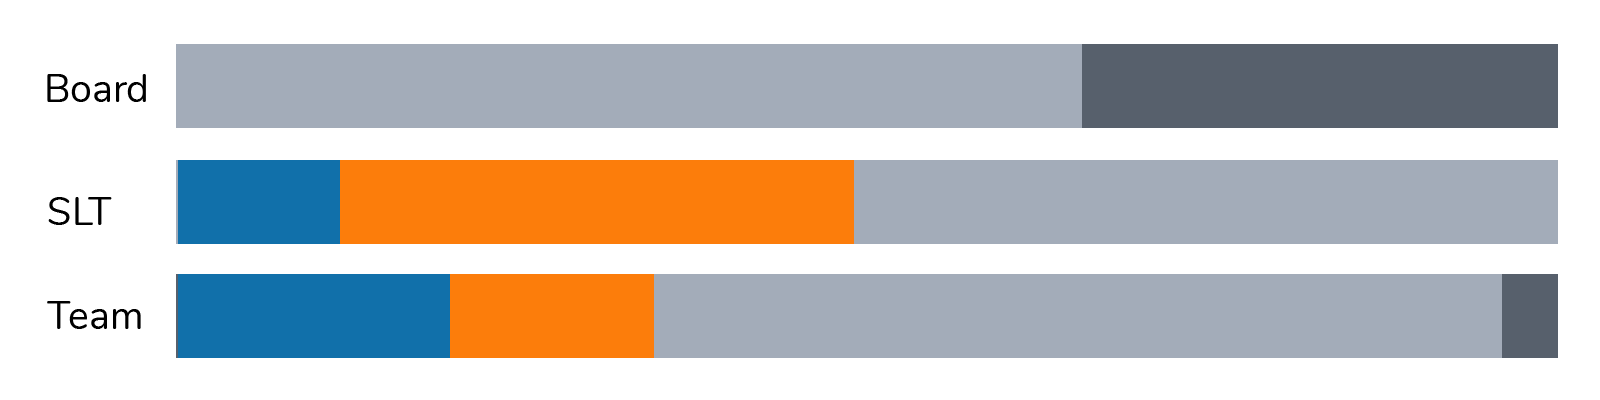
What is your age?
A free text field was not offered for this question.
The age of the team as a whole is similar to 2021, except in the 45-54 age group, which increased by 5pp from 2.7 to 7.7.%. Most of the corresponding decrease was in the 25-34 age group.
2021
2023
| Key | Response | Year | Team | SLT | Board |
|
|
18-24 | 2021 | 6.4 | ||
| 2023 | 4.2 | ||||
| 24-34 | 2021 | 62.7 | 28.6 | ||
| 2023 | 58.9 | 37.5 | |||
| 35-44 | 2021 | 27.3 | 28.6 | 60.0 | |
| 2023 | 27.4 | 25.0 | 50.0 | ||
| 45-54 | 2021 | 2.7 | 42.9 | 20.0 | |
| 2023 | 7.1 | 37.5 | 33.3 | ||
| 55-64 | 2021 | 0.9 | 20.0 | ||
| 2023 | 1.2 | 16.7 | |||
| Prefer not to say | 2023 | 1.2 |
What nationality(ies) are you?
Spektrix offices are based in the UK and US, so we offered two specific options - American and British - as well as ‘Nationality(ies) not listed’ and ‘Prefer not to say’.
22.8% of the wider team listed an additional or different nationality. In total, 27 different nationalities were listed compared to 17 in 2021.
These were:
American, Australian, Austrian, British, Canadian, Caribbean, Chilean, Danish, Dutch, French, German, Greek, Grenadian, Indian, Irish, Italian, Lithuanian, New Zealand, Nigerian, Norwegian, Polish, Portuguese, Puerto Rican, South African, Swiss, Taiwanese, Turkish
Which language(s) do you speak at home?
Spektrix offices are based in the US and UK, so we offered English as an option as well as ‘Language(s) not listed’ and ‘Prefer not to say’.
19.2% of the wider team listed an additional or different language. In total, 29 different languages were spoken compared to 17 in 2021.
These were:
Arabic, Danish, Dutch, English, French, German, Greek, Gujarati, Hindi, Italian, Lithuanian, Mandarin, Marathi, Ndebele, Polish, Portuguese, Sanskrit, Scots, Serbo-Croat, Spanish, Swati, Swedish, Thai, Turkish, Urdu, Welsh, Xhosa, Yoruba, Zulu
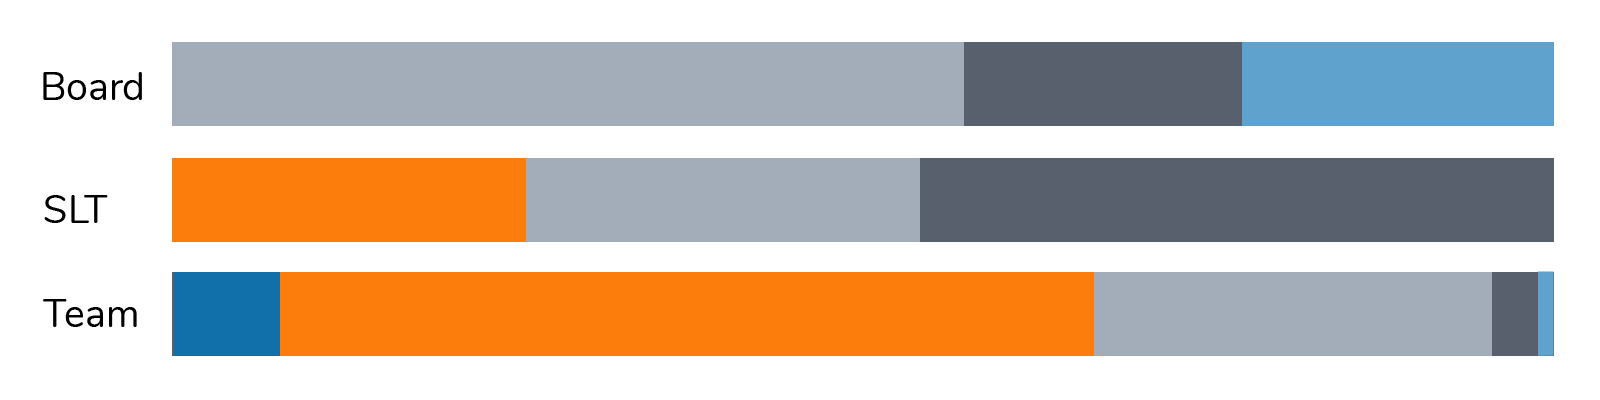
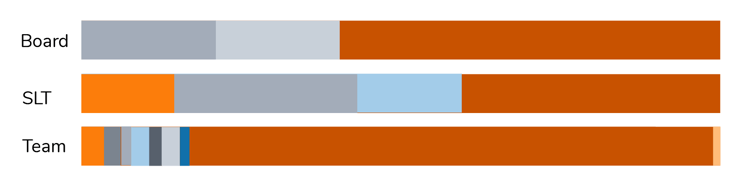
Which of the following categories best describes your race and/or ethnicity?
The options presented for this question were based on a combination of census categories from the UK and US. Before asking people to choose a category, we invited them to self-identify using a free text field. The combination of free text and categorized data allows us both to recognize and list people's self-described identities, and to draw useful comparisons over time and across the team.
In 2021, a number of team members chose the 'White' category but self-identified as Jewish. In response to this, we added Jewish as a category in its own right in 2023, and will continue to review the categories we offer to make them as representative as possible.
The next time we survey we also plan to make it easier for team members to tell us if they feel none of the categories we've offered for race/ethnicity fit well with their personal identity.
The overall ethnic diversity of the team has increased slightly, with the proportion of team members identifying as White decreasing by 1.9pp.
The proportion of team members identifying as Black has doubled from 3.5 to 7%. Whilst other identities have decreased as a proportion of the growing team, overall numbers have changed only slightly.
2021
2023
| Key | Response | Year | Team | SLT | Board |
|
|
Black (including Black British, Black American, African-American, African, Caribbean or any other Black background) | 2021 | 3.6 | 14.3 | |
| 2023 | 7.1 | 12.5 | |||
| East Asian (including Chinese, Japanese, Korean, Mongolian, Tibetan and Taiwanese) | 2021 | 2.7 | |||
| 2023 | 1.8 | ||||
| Jewish | 2021 | 1.8 | 28.6 | 20.0 | |
| 2023 | 1.2 | 25.0 | 16.7 | ||
| Latin(o,a,x,e) or Hispanic | 2021 | 2.7 | 14.3 | ||
| 2023 | 1.8 | ||||
| Mixed Race | 2021 | 1.8 | |||
| 2023 | 3.0 | ||||
| South Asian (including Bangladeshi, Bhutanese, Indian, Nepali, Pakistan, and Sri Lankan) | 2021 | 2.7 | 20.0 | ||
| 2023 | 1.8 | 12.5 | 16.7 | ||
| South East Asian (including Burmese, Cambodian, Filipino, Hmong, Indonesian, Laotian, Malaysian, Mien, Singaporean, Thai and Vietnamese) | 2021 | 1.8 | |||
| 2023 | 1.8 | ||||
| White (including White British, White American, White European, English, Welsh, Scottish, British, Irish or any other white background) | 2021 | 81.8 | 42.9 | 60.0 | |
| 2023 | 79.8 | 50.0 | 66.7 | ||
| None of the above | 2023 | 0.6 | |||
| Prefer not to say | 2021 | 0.9 | |||
| 2023 | 1.2 |
Members of the wider team provided 40+ different free text responses. These included:
African, African American, African American/Black & Puerto Rican/Latine, Asian, Asian British, Black, Black African, Black African American, Black African British, Black British, British, British Caucasian, British Indian Asian, Caribbean, Chinese, Chinese American, Latin American Hispanic, Indian, Indian South Asian, Jewish, Latinx, Mediterranean, Mixed Race, Polish, South Asian, White, White American, White Ashkenazi Jewish, White Caucasian, White British, White English, White European, White European Jewish, White Greek, White/Hispanic, White Irish, White Irish British, White Jewish
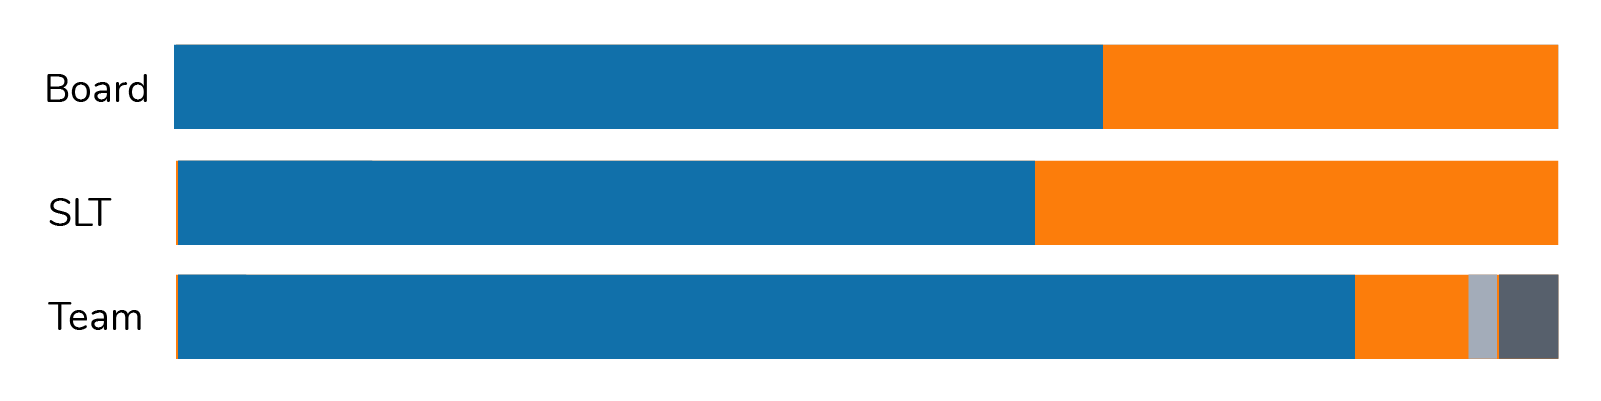
Which of the following categories best describes your gender?
The options offered were Agender, Female, Male and Non-Binary, although nobody selected Agender on this occasion. A free text field was also offered.
This and the next two questions follow guidance produced by UK charity Stonewall.
At all levels, there’s been an increase in the proportion of male team members.
The corresponding reduction has largely been in the proportion of female team members. The proportion of people identifying as non-binary is largely unchanged.
2021
2023
| Key | Response | Year | Team | SLT | Board |
|
|
Female | 2021 | 52.7 | 28.6 | 20.0 |
| 2023 | 45.8 | 12.5 | 16.7 | ||
| Male | 2021 | 41.8 | 71.4 | 80.0 | |
| 2023 | 48.2 | 75.0 | 83.3 | ||
| Non-binary | 2021 | 4.5 | |||
| 2023 | 4.2 | ||||
| None of the above | 2023 | 12.5 | |||
| Prefer not to say | 2021 | 0.9 | |||
| 2023 | 1.8 |
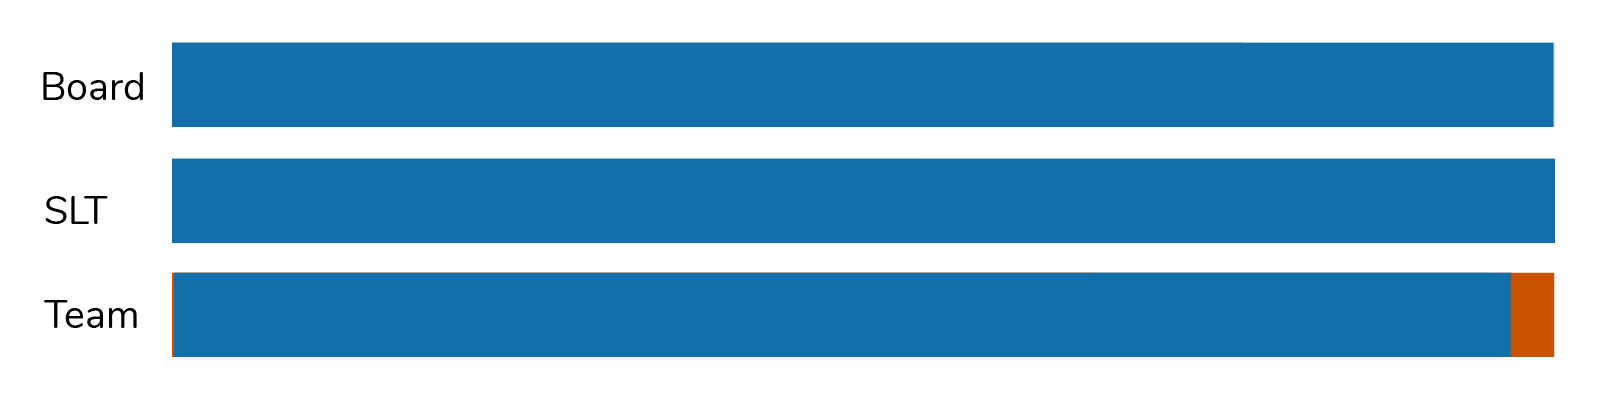
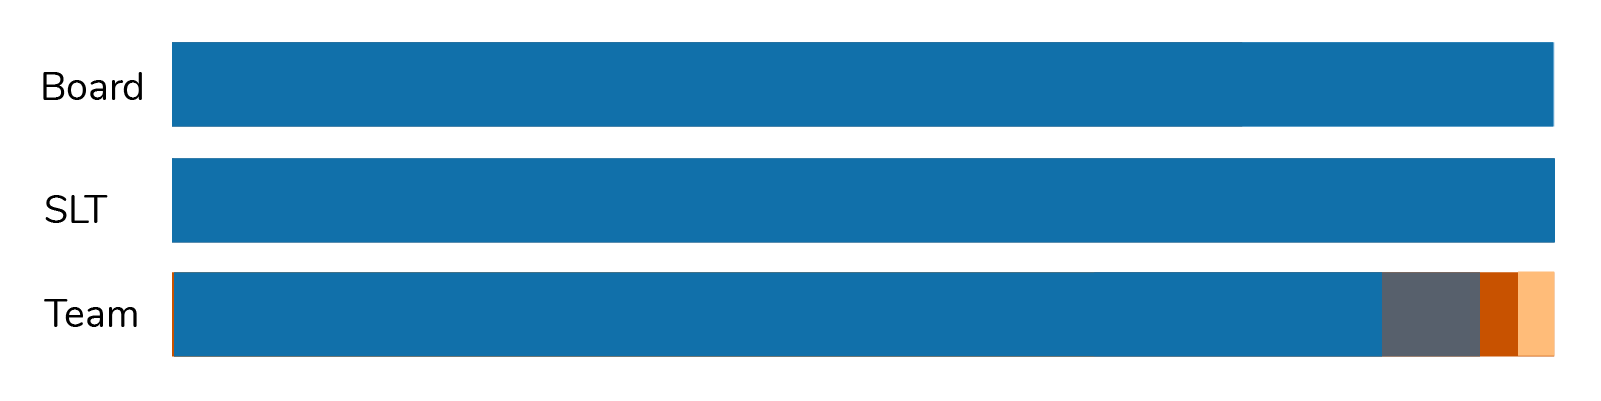
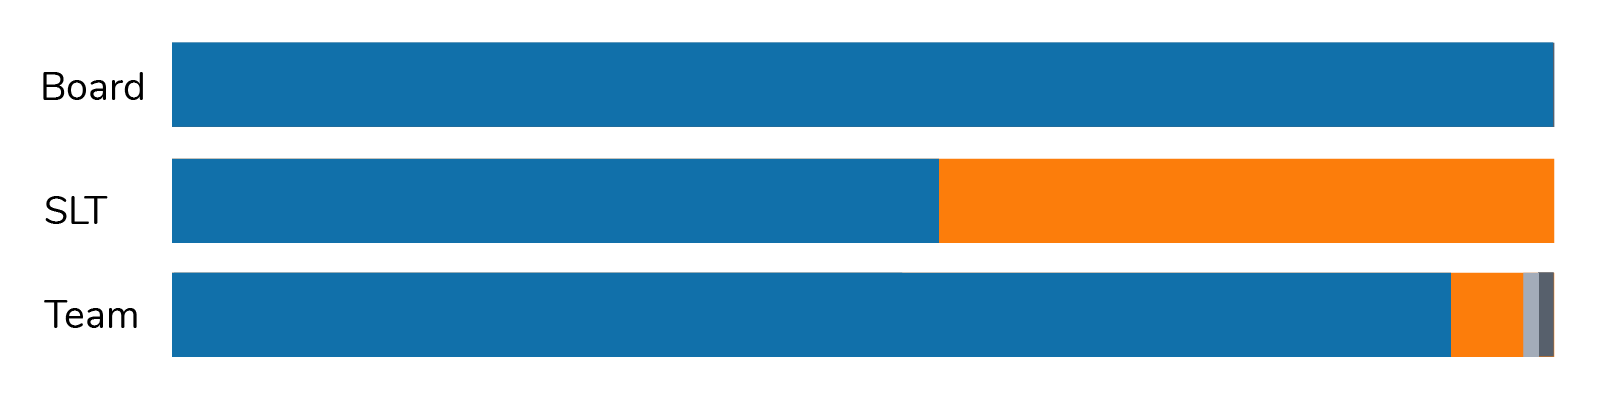
Do you identify as trans?
We changed the wording of this question from, ‘Are you transgender’ to ‘Do you identify as trans’?
We know it’s important to recognize demographics as part of people’s innate identity and not as a choice or preference. That awareness informed the wording of this question in 2021; we’ve since reviewed guidance from Stonewall and followed their advice in 2023.
Trans people are only represented at Team level. Since 2021, there’s been a 1.0 pp reduction in the proportion of team members who identify as trans.
This year, a small number of team members told us they preferred not to answer this question.
2021
2023
| Key | Response | Year | Team | SLT | Board |
|
|
No | 2021 | 97.3 | 100 | 100 |
| 2023 | 96.4 | 100 | 100 | ||
| Yes | 2021 | 2.7 | |||
| 2023 | 1.8 | ||||
| Prefer not to say | 2023 | 1.8 |
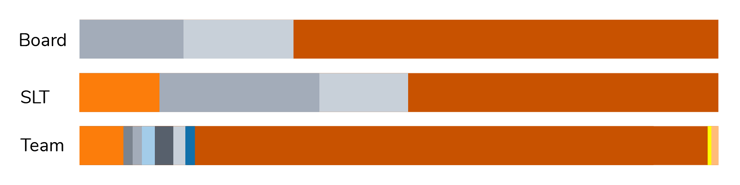
What is your sexual orientation?
The proportional changes in response to this question are generally very small.
At Team level, there are small increases in the proportion of team members identifying as Heterosexual/Straight, Queer, and Gay/Lesbian.
The only defined group which has reduced in size is Bi/Pansexual; however, there’s also been a small increase in the proportion who Prefer to Self Describe.
2021
2023
| Key | Response | Year | Team | SLT | Board |
|
|
Bi / Pansexual | 2021 | 16.4 | ||
| 2023 | 11.3 | ||||
| Gay / Lesbian | 2021 | 11.8 | 14.3 | ||
| 2023 | 13.1 | 12.5 | |||
| Heterosexual / Straight | 2021 | 60.9 | 85.7 | 100.0 | |
| 2023 | 61.3 | 87.5 | 83.3 | ||
| Queer | 2021 | 3.6 | |||
| 2023 | 7.1 | ||||
| Prefer to self-describe | 2021 | 1.8 | |||
| 2023 | 3.0 | ||||
| Prefer not to say | 2021 | 5.5 | |||
| 2023 | 4.2 | 16.7 |
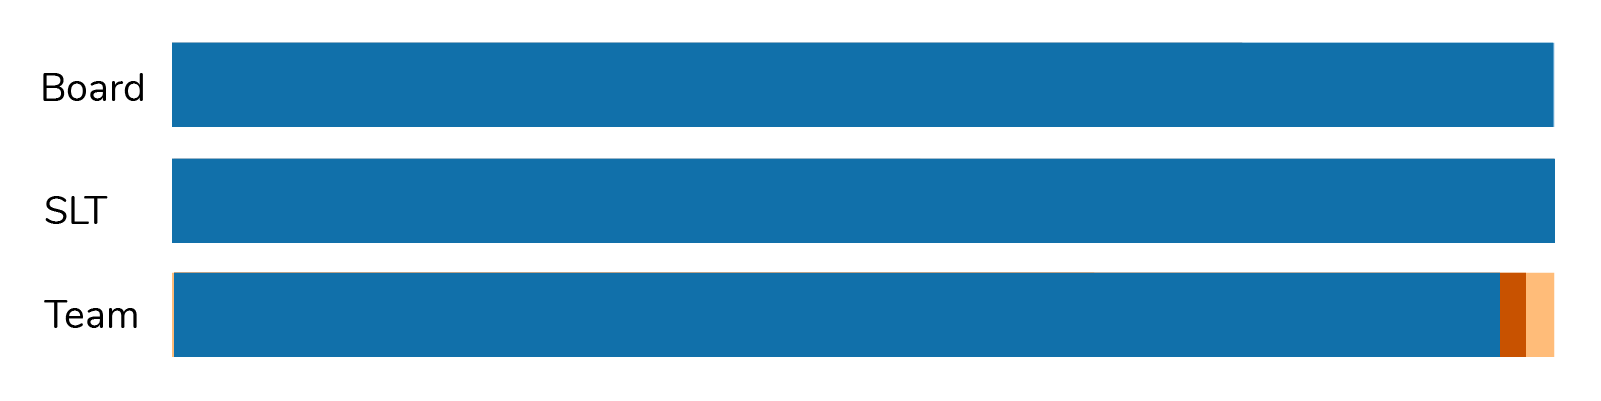
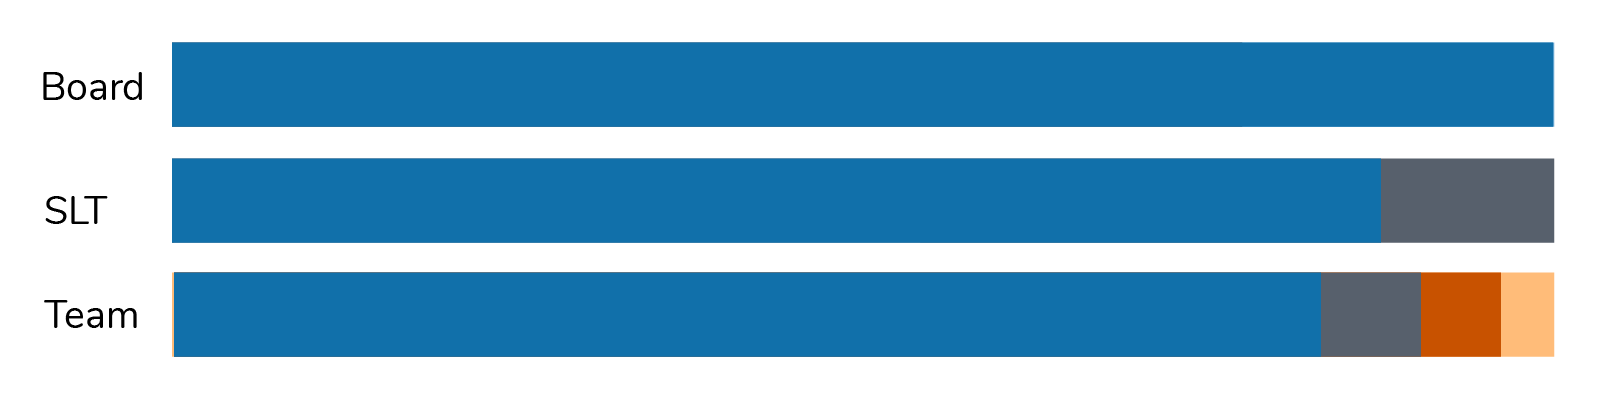
Do you consider yourself to be disabled?
There’s been a small increase in the proportion of team members who identify as disabled.
The proportions of team members who Prefer to Self Describe or Prefer Not to Say have also increased, with a corresponding decrease in the proportion who don’t consider themselves disabled.
2021
2023
| Key | Response | Year | Team | SLT | Board |
|
|
No | 2021 | 88.2 | 100.0 | 100.0 |
| 2023 | 83.3 | 87.5 | 100.0 | ||
| Yes | 2021 | 6.4 | |||
| 2023 | 7.1 | 12.5 | |||
| Prefer to self-describe | 2021 | 2.7 | |||
| 2023 | 6.0 | ||||
| Prefer not to say | 2021 | 2.7 | |||
| 2023 | 3.6 |
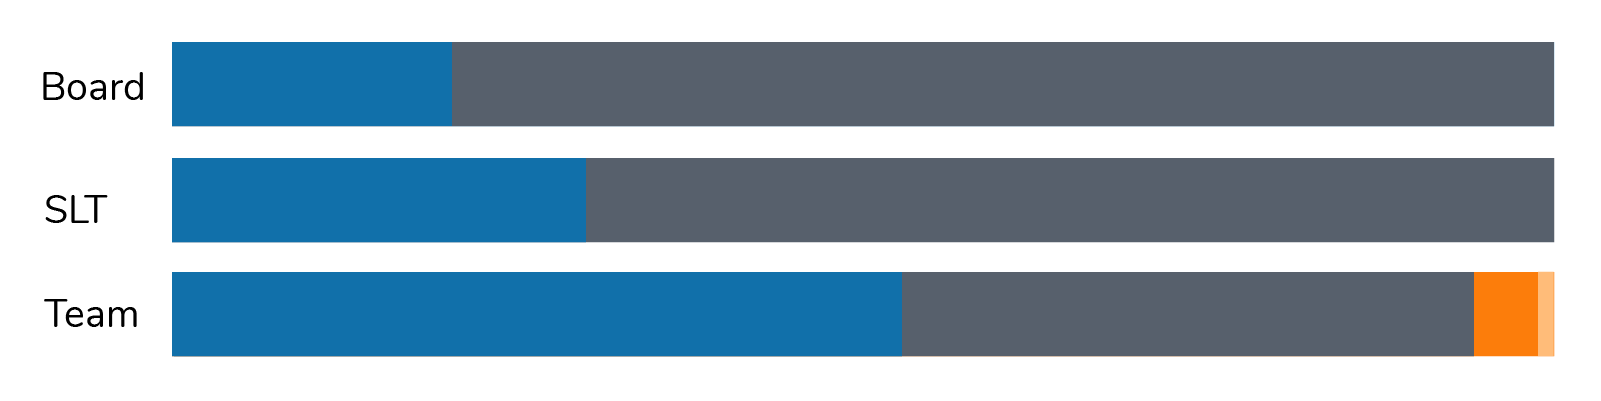
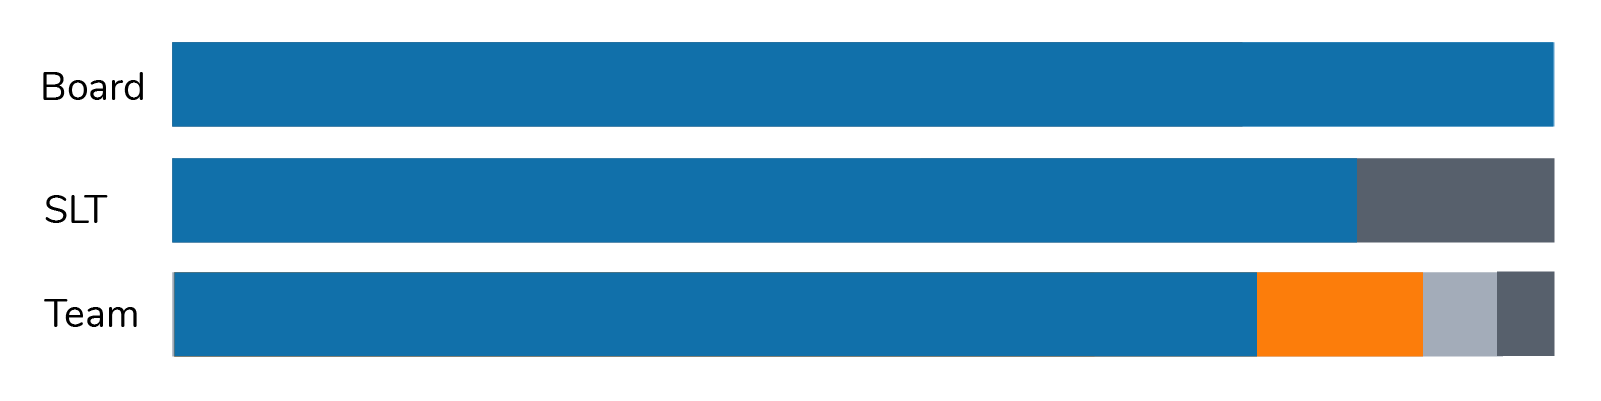
Do you consider yourself to be neurodivergent?
The proportion of team members who consider themselves to be neurodivergent has almost doubled, from 11.8% to 21.9% of the team.
Fewer people told us they did not consider themselves to be neurodivergent, and fewer people preferred to self describe, than in 2021.
2021
2023
| Key | Response | Year | Team | SLT | Board |
|
|
No | 2021 | 78.2 | 85.7 | 100.0 |
| 2023 | 70.8 | 87.5 | 100.0 | ||
| Yes | 2021 | 11.8 | |||
| 2023 | 21.4 | 12.5 | |||
| Prefer to self-describe | 2021 | 5.5 | |||
| 2023 | 2.4 | ||||
| Prefer not to say | 2021 | 4.5 | 14.3 | ||
| 2023 | 5.4 |
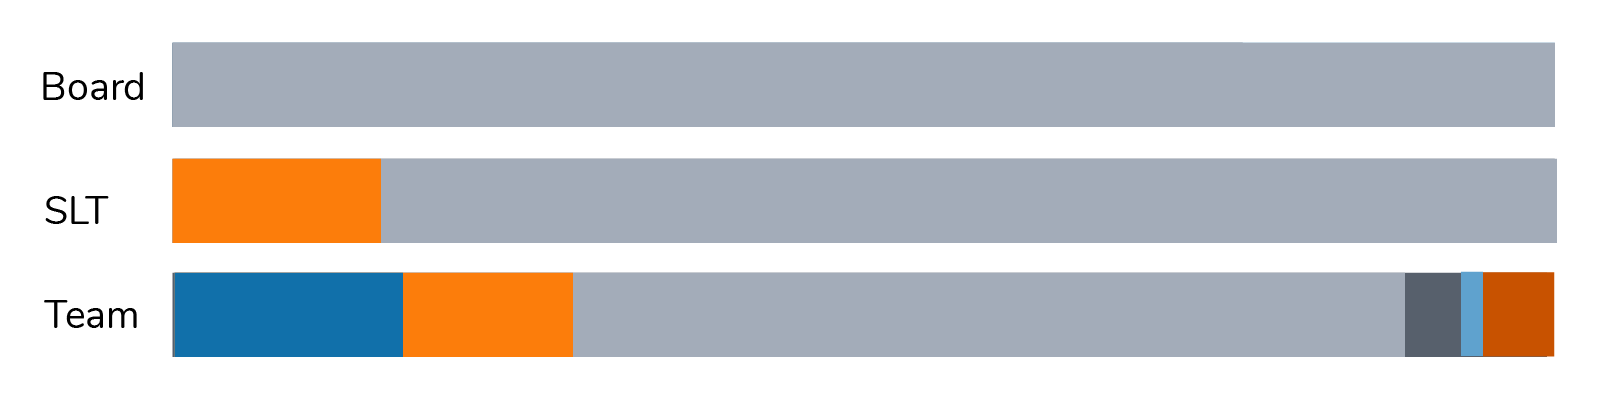
Do you look after or care for someone with long term physical or mental ill health (not in a paid capacity)?
There’s been a small increase at in the proportion of people with caring responsibilities.
There was also a small increase in Team members who told us they Prefer Not to Say or Prefer to Self Describe in response to this question.
2021
2023
| Key | Response | Year | Team | SLT | Board |
|
|
No | 2021 | 92.7 | 57.1 | 100.0 |
| 2023 | 86.3 | 62.5 | 66.7 | ||
| Yes | 2021 | 5.5 | 42.9 | ||
| 2023 | 7.1 | 37.5 | 33.3 | ||
| Prefer to self-describe | 2021 | 0.9 | |||
| 2023 | 1.8 | ||||
| Prefer not to say | 2021 | 0.9 | |||
| 2023 | 4.8 |
Continually improving our approach to demographic measurement and inclusion
We measure team demographics for two main reasons:
-
To understand the current demographic makeup of our team and how that changes over time
-
To hold ourselves accountable for building an increasingly representative team
Last year we surveyed team members using an anonymized form. This was a useful tool with which to understand team demographics, but not helpful in measuring how people’s identities related to their experience of recruitment, onboarding or working at Spektrix, since we couldn’t easily map responses to other surveys of team engagement or satisfaction. This year, improvements to our employee engagement tool, CultureAmp, means we can run demographic and engagement surveys through the same tool. This allows us to retain high levels of privacy and anonymity, but will also enable us to identify differences in feelings of inclusion, opportunities for progression, and investment in company values against individual and intersectional demographic groups.
Alongside this change in our measurement tools, we’ve continued to review our questions and the language we use in each of them; the main changes are set out above, alongside the relevant questions. We’ll continue to improve our approach based on sector guidance, free-text responses and internal feedback, before we next measure team demographics in 2024.
Interested in joining our team? Visit our Careers page to view open roles or submit a speculative application.
Michael Nabarro is CEO and co-founder of Spektrix