Ticket Sales Dashboard
See the latest trends for your region and artform, based on data from 480 organizations across the culture and entertainment sector
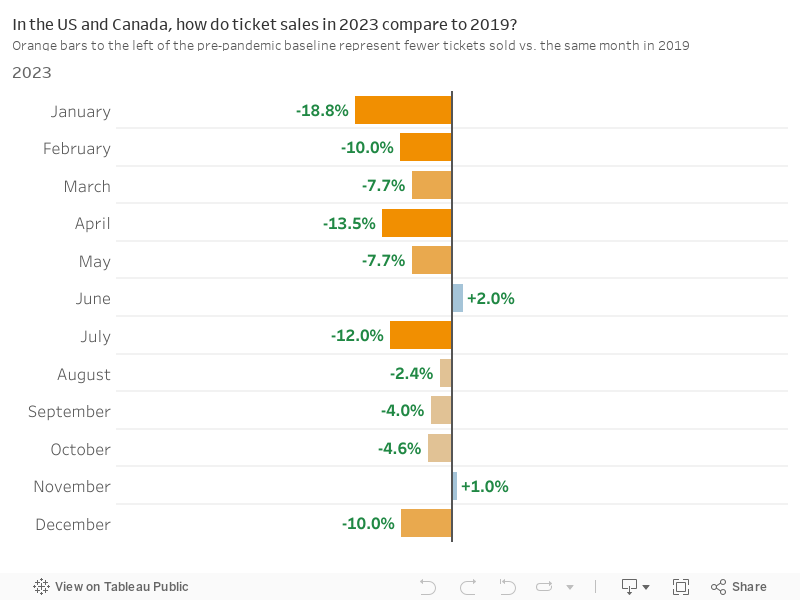
2023 Ticket sales in the US and Canada reached 93% of 2019 levels.

US and Canada
- In 2023, ticket sales tracked consistently below 2019 levels, with only 2 months (June and November) performing slightly better than 2019
- 2023 sales show an improvement over 2022 levels, but still sit below 2019 levels
- This is something we will continue to monitor in 2024. We’ll start using 2023 as our baseline and track sales trends periodically throughout the year
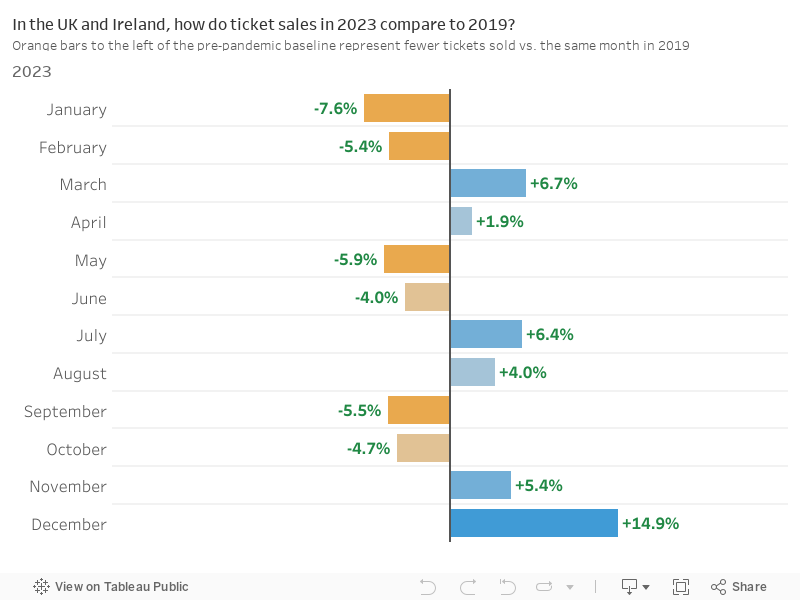
UK and Ireland
- In 2022, ticket sales in the UK and Ireland reached 92% of 2019 levels
- In 2023 ticket sales in the UK and Ireland reached 101% of 2019 levels
- In 2022, we saw a general upward trajectory in recovery, with most months making incremental progress towards 2019 levels, ending with December sales reaching 1.6% above 2019 sales
- 2023 has seen an oscillating pattern of sales, which has meant that 2023 ended the year on sales quantities equivalent to 2019 overall
- This could be indicative of changing audience purchase behaviour (e.g. school holidays playing a bigger role in sales overall), or align with specific large onsales
- We will continue to look at sales patterns in 2024 compared to 2023 (rather than 2019) to see if this trend continues, updating periodically throughout the year