

6 min read

Since 2020 we’ve been exploring new methodologies for measuring the demographics of arts audiences, and we’re now working with user organisations to trial new methods for reducing participation bias and collecting more reliable data.
Research carried out with users, partners and experts over the last 18 months identified three common problems with the way in which we measure and monitor the demographics of audiences for arts and entertainment events. Small sample sizes, participation bias, and infrequent or inconsistent measurement combine to make it difficult to truly know who’s attending; and in turn, that makes it difficult to measure or improve on the impact of initiatives promoting diversity. Our Sector Strategy Lead, Liv Nilssen, wrote about this in more detail during our research phase.
Now we’re beginning to test possibilities for improvement, beginning with a focus on participation bias. Spektrix CEO and co-founder, Michael Nabarro, explains a little more about this problem and why we believe it’s the key to more successful measurement.
“At Spektrix we believe that arts audiences should represent the communities in which organisations are based. Our gut sense tells us that’s often not the case, and that instinct is generally supported by surveys and other efforts to measure audience demographics. But effective, accurate measurement is harder than it looks. Traditional approaches such as email surveys are unlikely to reach a truly random sample of audience members, and therefore the data they provide are at best weak, and at worst inaccurate. As a sector, if we don’t understand who our audiences are then we can’t hold ourselves to account. But by using weak data as the basis for driving decisions and allocating resource, we risk expending budget and energy on high profile activity with limited impact whilst overlooking other approaches that are more effective drivers for change.
“It’s my belief that, of the three core problems we’ve identified, the greatest blocker to real insight is participation bias. By that we mean the likelihood that certain audience members will be more responsive to traditional data collection methods than others; for example, those with greater loyalty to a venue, with more time or who engage more actively with email communications may be more inclined to complete a post-event survey, meaning the data collected is unlikely to be truly random. Furthermore, across the sector, survey response rates are known to be very low. With substantial time or budget resource it might be possible to increase response rates - but unless we also address participation bias, this investment might only embed false assumptions more deeply.
“With many organisations and funders rightly prioritising diversity, we’re working with the sector to explore new approaches to this challenge. We don’t expect to find any instant solutions, but I’m excited to see some of our hypotheses being put into practice.”
Experiment #1: Birmingham
My regular work at Spektrix is as Implementation Lead in North America, helping new users get started with the system. However, my experience of coordinating audience demographic surveys at Broadway shows for the Broadway League’s annual reports means that I’m also working with Michael and Liv to project manage this research.
Before our first experiment, we set out a clear methodology to ensure we knew what we were testing and why. At this stage it was not our ambition to collect enough data to draw conclusions about audience identity. Instead, our goal was to test a specific hypothesis and work towards a method of survey collection that was ethical, statistically sound and replicable across many settings.
Common approaches to demographic data collection include:
- E-surveys, often emailed to lead bookers after an event. However, these reach only a single party member; tend to exclude ‘walk up’ bookers; and rely on people engaging with email communications, all of which are likely to reduce sample size and bias responses towards those with whom organisations have the strongest relationships.
- Proxy counting, which means staff teams estimating attendance based on the visual appearance of visitors. We found these methods to be insufficiently accurate and ethically problematic to be useful for our aims.
Our research suggested that in-person surveying was the best method for collecting sufficiently random data. Our first experiment sought to test this assumption and establish the level of resource required to carry out in-person surveying effectively.
We were grateful to B:Music in Birmingham, England, for inviting us to join them at their flagship venue, Symphony Hall, for a week in December. Alongside their team, we carried out in-person surveys over five nights, deliberately choosing a week of events which ranged from popular and classical orchestral programmes to family film music and Jason Donovan - enabling us to see how different audience segments responded to our approach.
Survey design
We set out to create a survey which would tell us some demographic characteristics of the audience for each event, and how welcome they felt at Symphony Hall. To encourage participation, it was vital that the questions were quick and easy to understand and complete in the moment.
Vis ual design: The survey had to fit on one, double-sided sheet of paper, in a font large enough to read easily and quickly, sometimes in low light and often by older audience members. Space was required to add B:Music’s own branding, outline incentives where relevant, and to tag each survey with a specific event and seat number.
Question design: The space allowed for five questions, chosen to align with B:Music’s priorities for audience development. People were first asked how welcome they felt at the venue, on 1-5 scale with space for a free text response. This was followed by four demographic questions in which people were asked to mark a single checkbox from a pre-defined range of options.
-
- What is your ethnic group?
Options were aligned with the 2021 UK census, and space allowed for people to describe their ethnicity if it was not listed. - What is your current or most recent occupation?
Nine options grouped occupations into ‘levels’ such as clerical, professional and technical occupations. This question was designed to measure social class, using a structure developed by the UK’s Social Mobility Commission. - Are you D/deaf, disabled and/or neurodivergent?
A Yes/No question with the opportunity to self-define or to state ‘Prefer not to say’.
- What is your ethnic group?
Notes were included on the back of the survey, explaining the purpose of the project and the reasons for collecting each piece of information.
Methodology
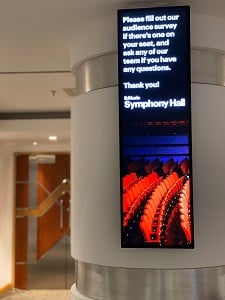
For each event, 2-3 members of the Spektrix team and 1-2 members of B:Music’s front of house team facilitated the completion and collection of surveys. Prominent signage at the venue encouraged people to complete the survey and invited them to engage with staff if they had any questions.
 Before each event, we randomly identified between 50-100 sold seats across different price zones in the Stalls. Before the house opened, we placed paper surveys on clipboards, with pens, on these seats; each survey was physically labelled with the price band, ticket type, offer used, price paid and performance name, so that data could be mapped to aggregate ticket information but not to an individual.
As people arrived we proactively approached and encouraged them to complete the survey, specifically asking them to ensure it was completed by the person sitting in the selected seat and not by another member of their party.
For some events we offered incentives such as a free drink or low-level gift voucher to test whether this had an impact on completion rates.
Findings
“As a Birmingham-based music charity we want to ensure we reflect the city we serve and yet we’re very aware that the way we measure that currently falls short. This trial has demonstrated how great our data deficiency is. We will continue to work with Spektrix on achieving our ambition which we hope will benefit not only the venues we’re responsible for but the sector as a whole.” Kath Lewin, Head of Marketing, B: Music
Generally, audience members welcomed our approach and were willing to take part. Some were actively interested in the project and its purpose, whilst others were persuaded by a prominent statement on the survey that it would take no more than 3 minutes to complete. Where an incentive was offered, they were particularly pleased to be selected.
The overall response rate was around 64%, which compares favourably to an average 25% response rate for e-surveying. Perhaps our most significant finding was that the response rate changed very little across different event types, or when incentives were offered; these were welcome, but appeared to have little influence on behaviour.
It was less clear whether the individuals seated in the randomly-selected seats were those who actually completed the surveys. If surveys were passed to another party member, or picked up by a passerby, this would reintroduce participation bias. Spektrix staff proactively engaged with audiences to encourage the intended individual to take part, but it was difficult to verify that this was always the case.
What's next?
The in-person approach required a high level of resource to be effective, with up to five team members involved in collecting 50-100 surveys. Whilst we believe this first experiment demonstrated some success in improving response rates and randomness, it’s also important that any approach can be practically and regularly repeated by venue teams. We’ll explore whether it’s possible to either reduce the resource required for effective sampling, or to evidence why that resource is a worthwhile investment for organisations truly interested in understanding and driving diversity.
For our next experiment, we plan to change our methodology and, instead of placing surveys on seats in advance, we’ll approach the people sitting in those seats to ask them to respond. Our goal is to increase the likelihood that the ‘correct’ individual is the one to complete the survey; and to understand how that difference in approach affects response rates and resource.
We’d love to connect with Spektrix users who are interested in partnering with us on this project - either by hosting trials at their events, or by sharing learnings and ideas. If you’d like to talk further, please drop me a line.
Mark Smith is Implementation Lead, North America, at Spektrix