

4 min read

Data on the demographic makeup of our team, leadership and board, measured in late 2021 as part of our focus on increasing diversity and creating a more inclusive workplace.
In July 2020 we published data relating to four demographic characteristics of members of our team, senior management (SMT) and board. At that point we committed to updating and reporting on that data annually, and this blog presents the results of a survey undertaken in late 2021. We've taken the time necessary to fully explore how we might improve both the quality of the data we’re collecting and the experience of team members who are asked to share personal information as part of the survey process. In a parallel blog, ‘Measurement and Inclusion’, I outline the questions we asked ourselves, the decisions we made, and the learnings we took from the process.
Our journey in this area is ongoing, and we’re happy to engage with questions, ideas or conversation. Please reach out to me at consultation@spektrix.com, or read the before referenced blog, ‘Measurement and Inclusion’, to discover more about our journey and decision making.
The language we use to describe demographic characteristics follows decisions taken in the development of the Spektrix Language and Identity guide in 2020. You can find a summary of our approach or you’re welcome to reach out to us to find out more.
Methodology and Engagement
We distributed an online survey to all Spektrix team and board members in late 2021. While most questions allowed for self description, there were a number of questions which specifically asked for free text responses where we felt this was needed to help reflect the true diversity of the team. To understand more about the approach we took to each question and the reason for our chosen methodology in each case, read ‘Measurement and Inclusion’.
Data are separated into three categories: our board, SMT, and wider staff team. SMT members are also included in the wider staff category. Spektrix CEO and co-founder Michael Nabarro is included in figures for both the board and SMT, and therefore appears in all three groups.
Across the company, 90% of staff members responded to the survey, an increase from 82% in July 2020. 100% of SMT and board members took part. All figures are given as percentages.
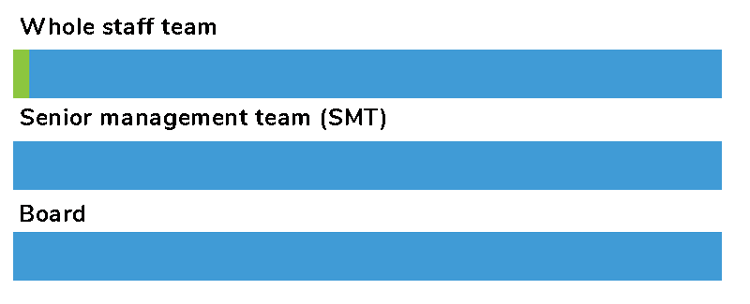
What best describes the occupation of your main household earner when you were aged about 14?
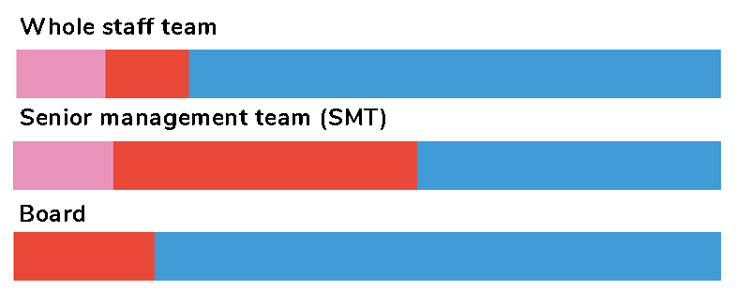
This question looks at the socio-economic background of team members (i.e. how privileged/affluent a background people have come from). There is no perfect way to measure socio-economic background, however we have taken the approach recommended by the UK’s Social Mobility Commission. Respondents selected one of seven categories, which have been aligned to three economic background levels in this data in line with Social Mobility Commission guidance.
A free text field was not offered for this question.
| Key | Aggregated response | Team | SMT | Board |
• |
Lower socio-economic backgrounds |
12.7 | 14.3 | |
• |
Intermediate backgrounds |
11.8 | 42.9 | 20 |
• |
Professional backgrounds |
75.5 | 42.9 | 80 |
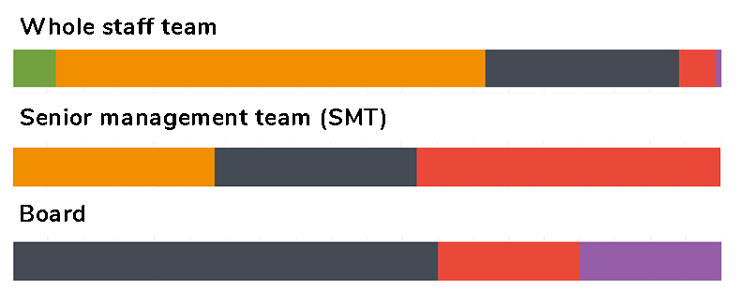
What is your age?
A free text field was not offered for this question.
| Key | Response | Team | SMT | Board |
• |
18-24 |
6 | ||
• |
25-34 |
60.7 | 28.6 | |
• |
35-44 |
27.4 | 28.6 | 60 |
• |
45-54 |
5.1 | 42.9 | 20 |
• |
55-64 |
0.9 | 20 |
What nationality(ies) are you?
Spektrix offices are based in the UK and US, so we offered two specific options - American and British - as well as ‘Nationality(ies) not listed’ and ‘Prefer not to say’.
20.5% of the wider team listed an additional or different nationality. These were:
Austrian Australian Brazilian Canadian Dutch French German Greek Italian Indian Irish Nigerian Portuguese Swiss Taiwanese
Which language(s) do you speak at home?
Spektrix offices are based in the UK and US, so we offered English as an option as well as ‘Language(s) not listed’ and ‘Prefer not to say’.
15.4% of the wider team listed an additional or different language. These were:
Cantonese Cypriot Greek French German Greek Hindi Italian Mandarin Ndebele Norwegian Portuguese Spanish Swati Welsh Xhosa Zulu
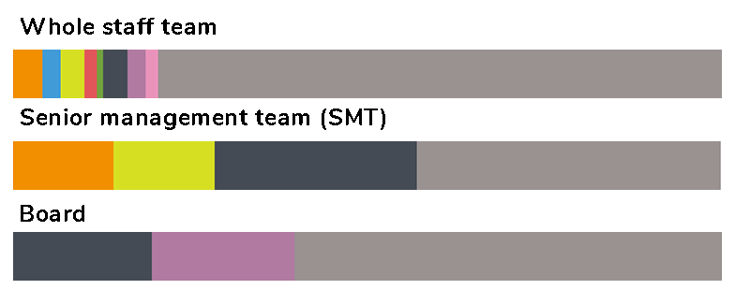
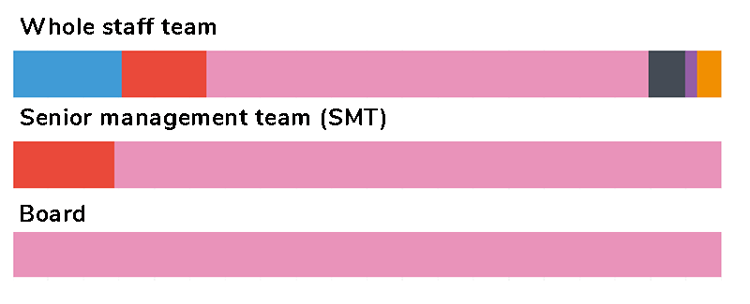
Which of the following categories best describes your race and/or ethnicity?
The options presented for this question were based on a combination of census categories from the UK and US.
A free text field was also offered. We expand on some of these responses, and how they’ll inform our methodology for 2022, in the accompanying ‘Measurement and Inclusion’ blog.
| Key | Response | Team | SMT | Board |
• |
Black (including Black British, Black American, African-American, Africa, Caribbean or any other Black background) |
4.3 | 14.3 | |
• |
East Asian (including Chinese, Japanese, Korean, Mongolian, Tibetan and Taiwanese) |
2.6 | ||
• |
Latin(o,a,x,e) or Hispanic |
3.4 | 14.3 | |
• |
Mixed Race |
1.7 | ||
• |
Prefer not to say |
0.9 | ||
• |
Self identified and not listed elsewhere |
3.4 | 28.6 | 20 |
• |
South Asian (including Bangladeshi, Bhutanese, Indian, Nepali, Pakistani and Sri Lankan) |
2.6 | 20 | |
• |
South East Asian (including Burmese, Cambodian, Filipino, Hmong, Indonesian, Laotian, Malaysian, Mien, Singaporean, Thai and Vietnamese) |
1.7 | ||
• |
White (including White British, White American, White European, English, Welsh, Scottish, Irish, Polish or any other White background) |
79.5 | 42.9 | 60 |
Members of the wider team provided a total of 38 different free text responses. These were:
Asian Asian-Southeast Asian-Filipino Asian-Taiwanese Asian-American Black African British Black American Black British of Caribbean descent British British South Asian Caucasian Caucasian-Sicilian-Irish Chinese Chinese-American Hispanic Hispanic-Puerto Rican Hispanic/Latino Indian Jewish Mixed race Native African North European South Asian White White-Irish & Polish White-Non-Hispanic/Latinx White/Mediterranean White American White American & Hispanic White & Hispanic/Latinx White British White Eastern European Ashkenazi Jewish White English White European White Hispanic White Irish White of Jewish heritage White-Eastern European-Jewish White-Welsh
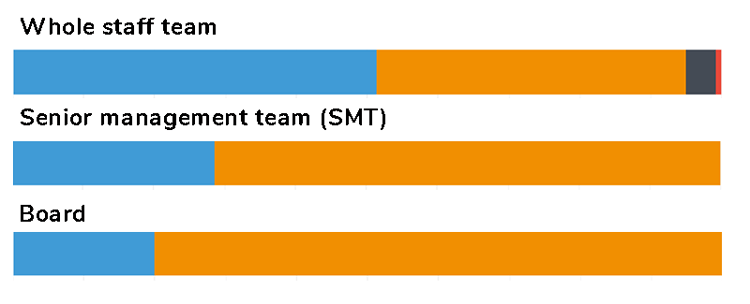
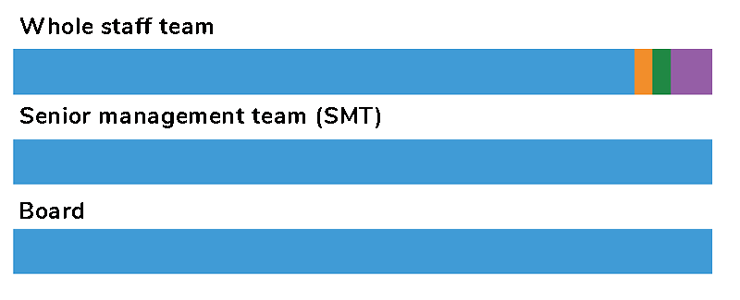
Which of the following categories best describes your gender?
The options offered were Agender, Female, Male and Non-Binary, although nobody selected Agender on this occasion. A free text field was also offered.
This and the next two questions follow guidance produced by UK charity Stonewall.
| Key | Response | Team | SMT | Board |
• |
Female |
51.3 | 28.6 | 20 |
• |
Male |
43.6 | 71.4 | 80 |
• |
Non-binary |
4.3 | ||
• |
Prefer not to say |
0.9 |
Are you transgender?
| Key | Response | Team | SMT | Board |
• |
No |
97.4 | 100 | 100 |
• |
Yes |
2.6 |
What is your sexual orientation?
| Key | Response | Team | SMT | Board |
• |
Bi / Pansexual |
15.4 | ||
• |
Gay / Lesbian |
12 | 14.3 | |
• |
Heterosexual / Straight |
62.4 | 85.7 | 100 |
• |
Prefer not to say |
5.1 | ||
• |
Prefer to self describe |
1.7 | ||
• |
Queer |
3.4 |
Do you consider yourself to be disabled?
| Key | Response | Team | SMT | Board |
• |
No |
88.9 | 100 | 100 |
• |
Prefer not to say |
2.6 | ||
• |
Prefer to self describe |
2.6 | ||
• |
Yes |
6 |
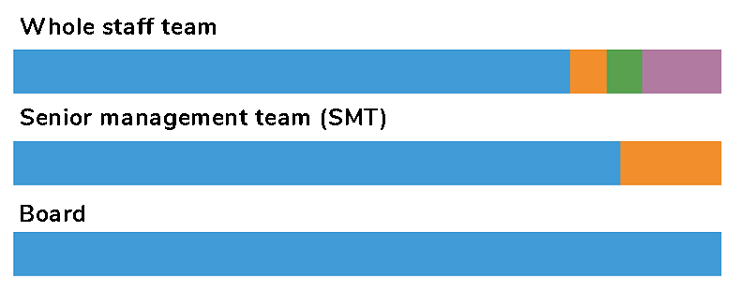
Do you consider yourself to be neurodivergent?
| Key | Response | Team | SMT | Board |
• |
No |
78.6 | 85.7 | 100 |
• |
Prefer not to say |
5.1 | 14.3 | |
• |
Prefer to self describe |
5.1 | ||
• |
Yes |
11.1 |
Do you look after or care for someone with long term physical or mental ill health (not in a paid capacity)?
| Key | Response | Team | SMT | Board |
• |
No |
90.6 | 57.1 | 100 |
• |
Prefer not to say |
0.9 | ||
• |
Prefer to self describe |
0.9 | ||
• |
Yes |
7.7 | 42.9 |
%3F%20Spektrix%202021.png?width=750&name=Do%20you%20look%20after%20or%20care%20for%20someone%20with%20long%20term%20physical%20or%20mental%20ill%20health%20(not%20in%20a%20paid%20capacity)%3F%20Spektrix%202021.png)
Find out more about Spektrix values and how we put them into practice
Zack Moore is VP of People at Spektrix